Example 0 : Getting started with SuMMIT on MNist
In the example, we will run SuMMIT on a famous dataset : MNist, available, already formatted in the project .
Even if MNist is a monoview dataset, we adapted it to be multiview. The multiview_mnist.hdf5 file contains 500 randomly selected samples from each label of the original MNist training set on which we computed a 12-direction Histogram of Oriented Gradients. Then, to create the views, we separated the directions in four randomly chosen groups of three directions.
So each view is comprised of 3 directions of a 12 direction HOG that was computed on 5000 samples.
Running SuMMIT on MNist
To run SuMMIT on MNist, we have to run :
>>> from summit.execute import execute
>>> execute("example 0")
This will start a benchmark with this config file.
By running SuMMIT with this configuration, one runs :
one decision tree on each view,
one early fusion decision tree multiview classifier that learns on the concatenation of all the views,
one late fusion decision tree classifier that learns one monoview classifier by view and aggregates their decisions in a naive majority vote.
First discovery of the main results
The results will be saved in this directory.
In this basic tutorial, we will only investigate the two main result files, however, during the other ones all the information given by the platform will be explained.
Getting the scores
The main result returned by SuMMIT is the scores of each classifier. For this example, we only asked for the accuracy and f1-score, but SuMMIT can work with many other metrics.
The file that outputs the accuracy scores of all the classifiers is available in three versions :
and an an html interactive file :
These three files contain the same information : the two figures are bar plots of the score of each classifier with the score on the training set in light gray and the score on the testing set in black.
Similarly, the f1-scores are saved in png, csv and html
With these results, we are able to assess which classifier performs the best, here both the fusions have interesting scores compared to their monoview counterparts.
Getting more information on the classification
Once one knows the scores of each classifier, an interesting analysis could be to verify on which samples each classifier failed, to detect potential outliers.
This is possible with another result analysis, available in png, csv and html :
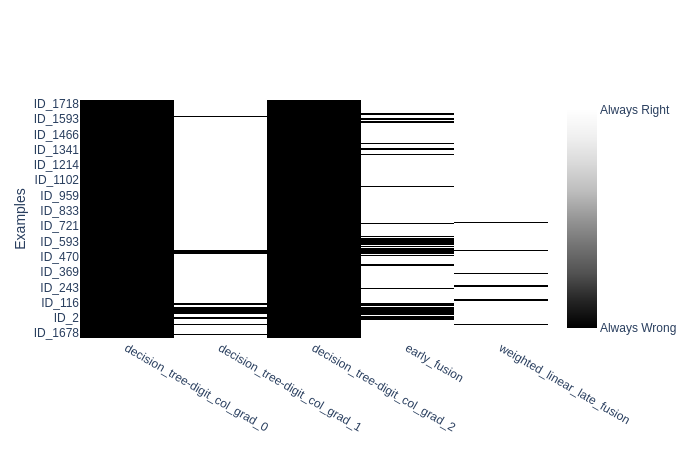
This figure represents a matrix, with the samples in rows and classifiers in columns, with a white rectangle on row i, column j if classifier j succeeded to classify sample i.
Note
To zoom on the image use your mouse to either draw a rectangle or drag it in a unique direction to zoom on an axis :
A quick analysis of it shows that a decision tree (DT) on the view digit_col_grad_0 is unable to classify any sample of labels 1, 2, 3 or 4. That both the other DTs have a similar behavior with other labels.
Concerning the fusions, if you zoom in on the samples labelled “2””, you may see that some errors made by the early fusion classifier are on samples that were mis-classified by the three DTs :
Conclusion
Thanks to SuMMIT we were able to get a benchmark of mono- and multiview algorithms on a classification task. In the following tutorials, we will develop the features of SuMMIT on several samples.